In this tutorial, we’ll show you how to interpret the Lightroom histogram and use it in your post-processing.
What is the Lightroom Histogram?
A histogram is a graphical representation of measurable data. It is basically a graph. It has an X-axis showing the values of a specific variable, and a Y-axis showing the amount or frequency of each value.
In photography, we meet two histograms: the image histogram and the color histogram. The former shows the tonal distribution of the image. It plots the number of pixels that each tonal value has in the image. The latter represents the distribution of colors in the image.
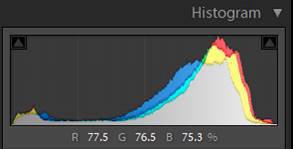
The image histogram is often displayed in the camera itself as well as in Lightroom. It helps us know the range of tones captured in the photo. It also helps us see whether any details were lost due to over or under exposure (clipped areas).
The color histogram can be seen as a merging of three histograms, each for the tonal range of red, blue and green.
How to Interpret the Histogram
To interpret a histogram, we have to break it down and understand it bit by bit. The tones are arranged along the X-axis of the graph from left to right going from dark to bright.
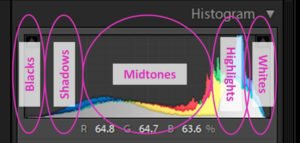
The axis is divided into areas. From left to right:
Blacks are where the pixels are so dark that we cannot differentiate and see details.
Shadows have dark pixels too. But we can see some details and differentiate between colors.
Midtones are where we can see clear details and different colors.
High tones are where we have bright colors and we can see details but have less contrast.
Whites have pixels so bright that we cannot differentiate between details or colors.
What Does a Histogram Look Like in Lightroom
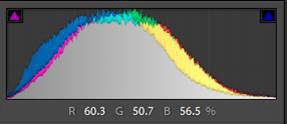
The Lightroom histogram also shows the color distribution. This is achieved by having three tonal graphs, red, green and blue, overlaid on top of each other.
In the midtones, we will often see that the graphs overlap and cover each other.
Areas in the histogram where red overlaps green are displayed in yellow. Areas where blue overlaps green are displayed in turquoise.
Areas where red overlaps blue are displayed in magenta.
All three colors overlap in the grey areas.
If your image has more of a specific color, the histogram will display more of that color too. If the image has more of a certain color in brighter tones, that color will be displayed more at the right-hand side.
Hover with the cursor over the image. You can see that the percentages of red, green and blue in that area appear underneath the histogram.
What Can You Learn About a Photo by Checking Its Lightroom Histogram
The histogram can give you a lot of information about your image.
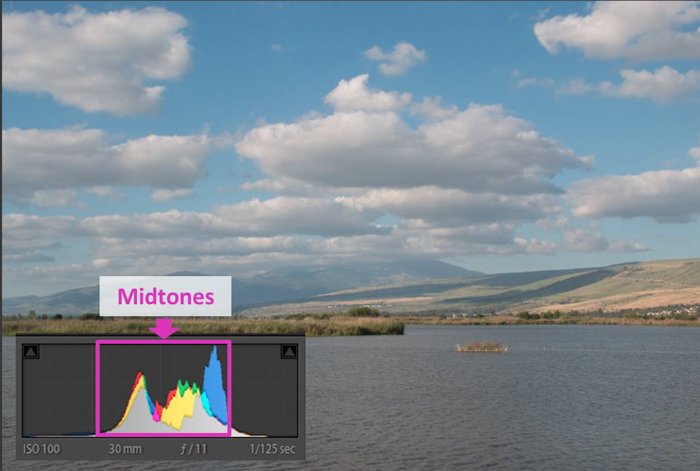
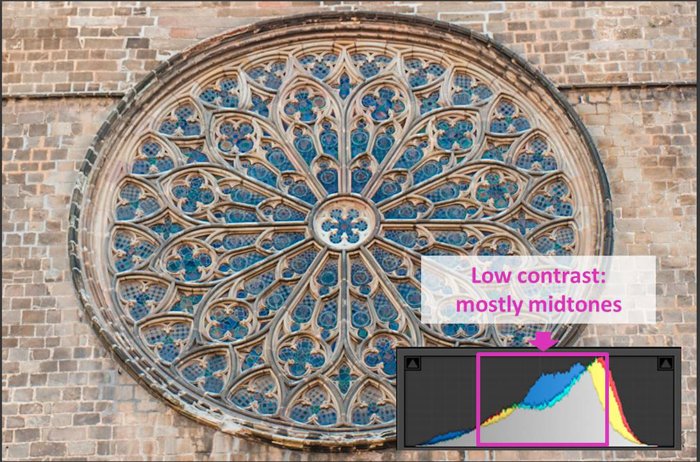
Your histogram might spread over the center of the axis and looks like a hill or a ridge with several peaks.
Then your image has mostly midtones and it has no areas with blown-out highlights or too dark shadows.
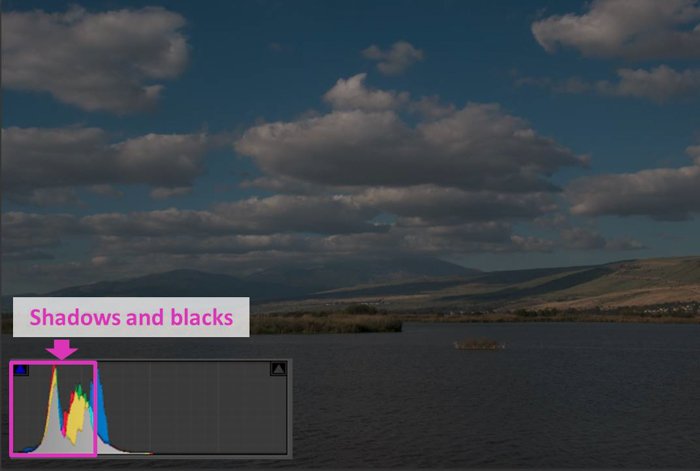
Your histogram might be mostly towards the left side. This means that most of the image pixels belong to the shadows and blacks.
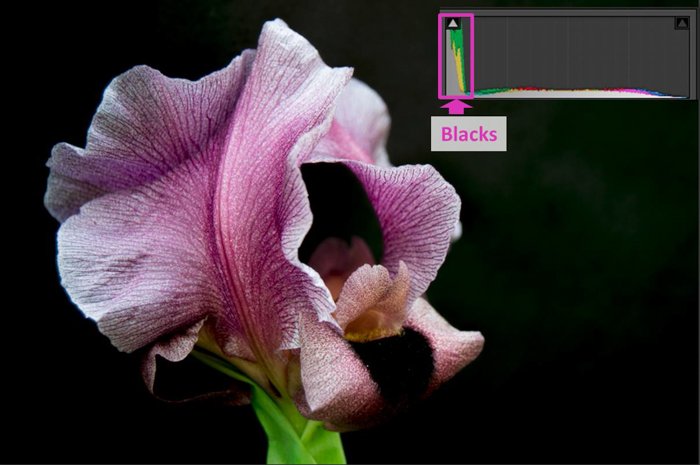
This might be because you are taking photos of a scene with a lot of blacks. Or it might show that your image is underexposed.
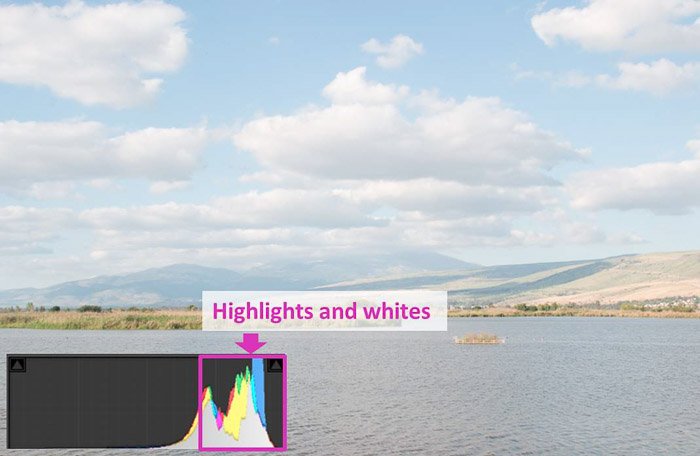
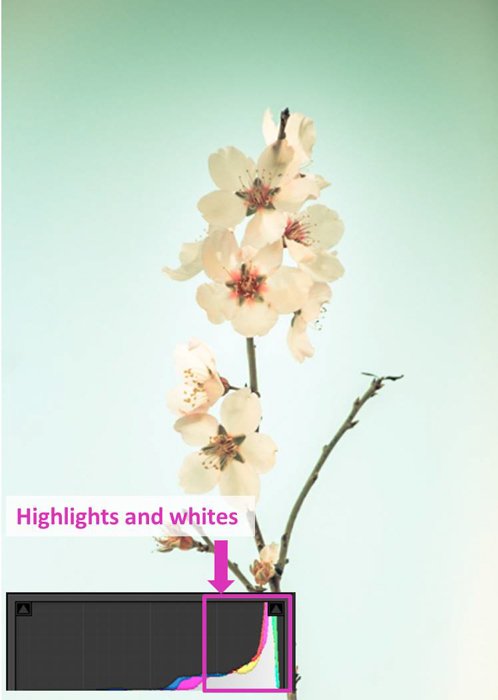
If the histogram is mostly towards the right, it means that the image has a lot of highlights and whites.
Either you are taking a photo of a white scene or your photo is overexposed.
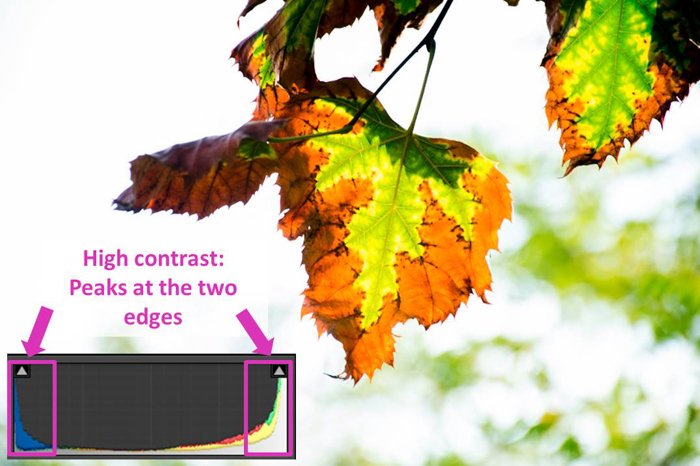
You can also read the contrast of the image using the histogram. A histogram that has mostly midtones belongs to low contrast images.
A histogram with peaks in the 2 edges belongs to a high contrast scene.
Steps to Consider Before Changing the Image According to the Lightroom Histogram
Before working with the histogram, there are a couple of things you should take into account.
As a first step, I recommend cropping your image first. When you crop, Lightroom readjusts the Histogram according to the new image.
If you make changes in the original image according to the histogram but then you crop it, you might need to redo the changes.
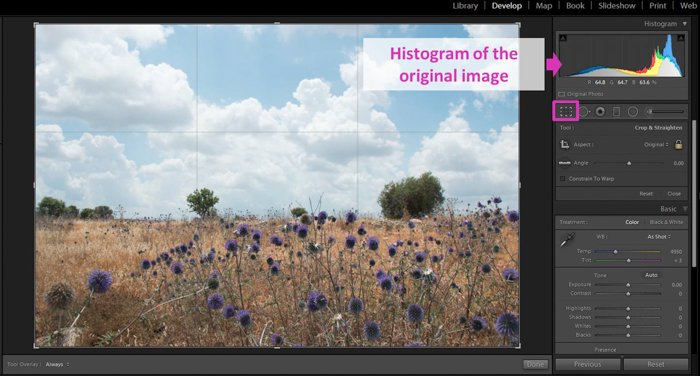
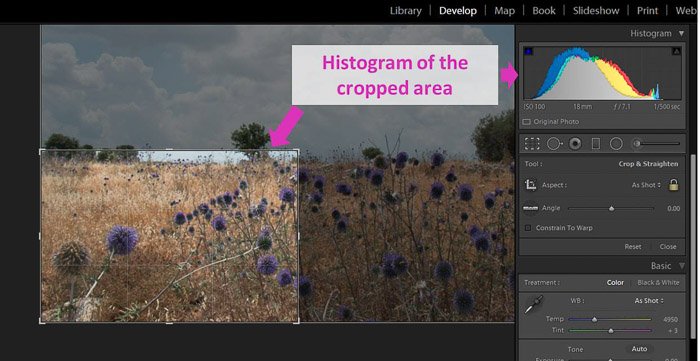
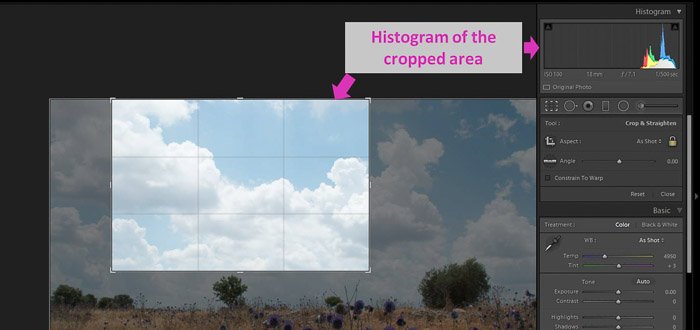
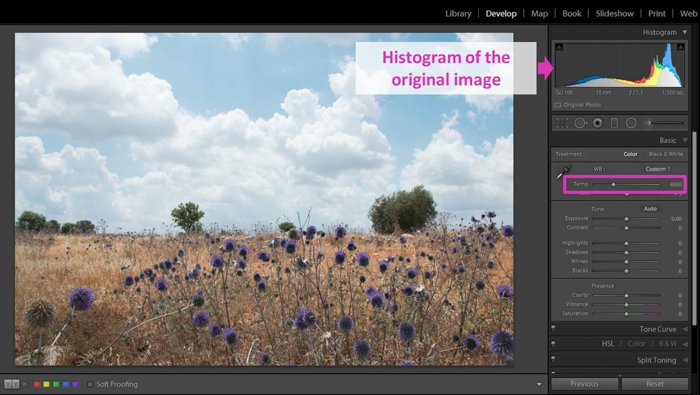
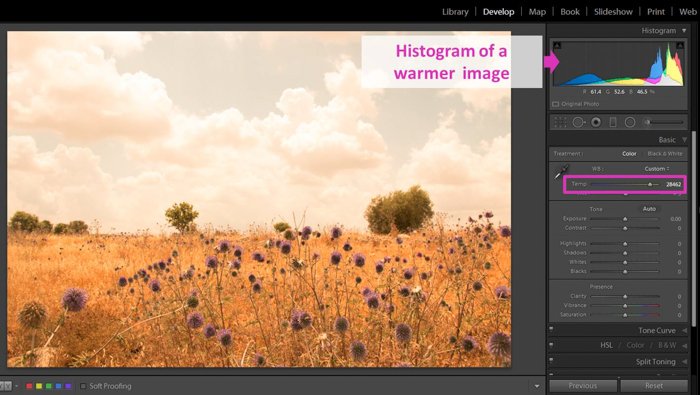
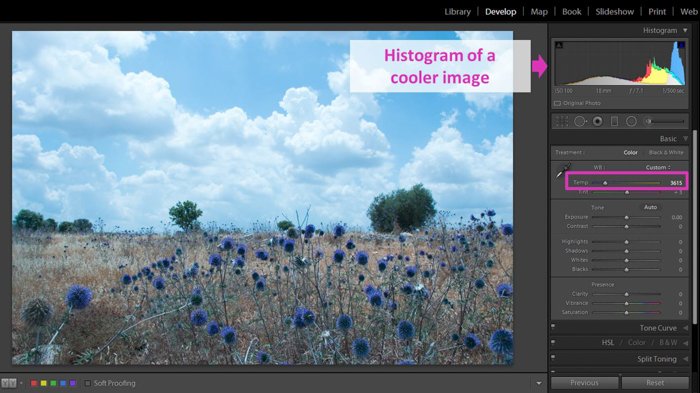
White Balance adjustments also have an effect on the color histogram. It’s better to adjust it before doing any other edits.
You can adjust the White balance using the slider in the Basic panel of the Develop module.
Change the Histogram From the Lightroom Develop Module
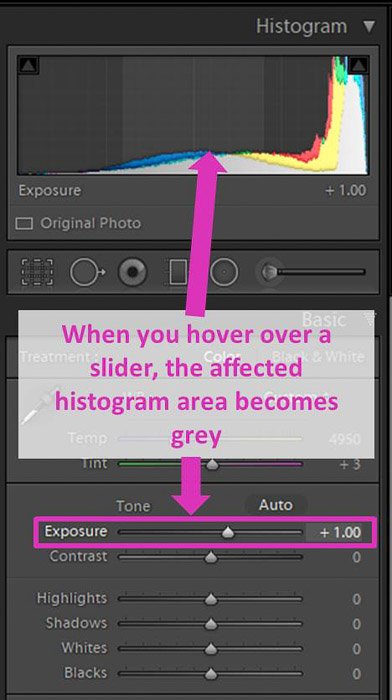
You can change the histogram in different ways. You can use the sliders in the basic panel. When you move one of them, you will see that the area affected the most in the Histogram appears in light grey.
The sliders with the most effect on the histogram are the Exposure (mid tones), highlights, shadows, whites and blacks. Each one of them corresponds to an area in the histogram.
If you need to zero a slider, you can do it by double-clicking on its name.
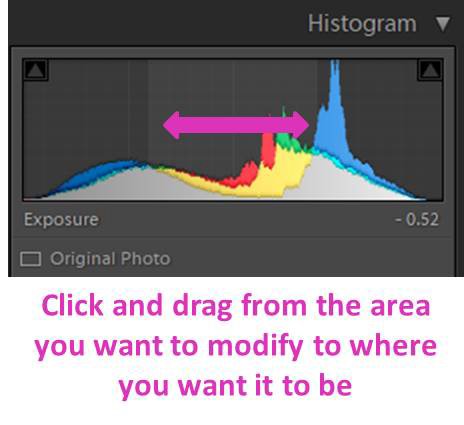
You can also change the histogram clicking and dragging in its areas.
It is exactly the same as using the sliders. Choosing one way or another is a matter of personal preference.
In fact, changes you made by dragging the histogram will appear in the basic sliders.
Find Clipped Areas of Your Images Using the Lightroom Histogram
The histogram can also help you check if there are any clipped areas in your image. An area is clipped either when the highlights are blown out (burnt) or the shadows are black.
This means that these particular pixels have no information. They are pure white (clipped highlights) or pure black (clipped shadows).
A histogram with clipped areas will have a high peak in one or both of its edges. As if it rides up over the right or the left side of the graph.
By looking at the histogram, you might have some doubts about the clipping. The peaks can be a bit misleading at the edges.
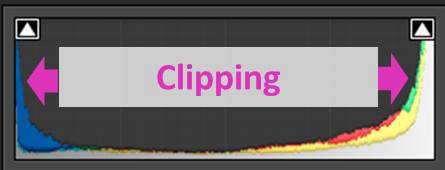
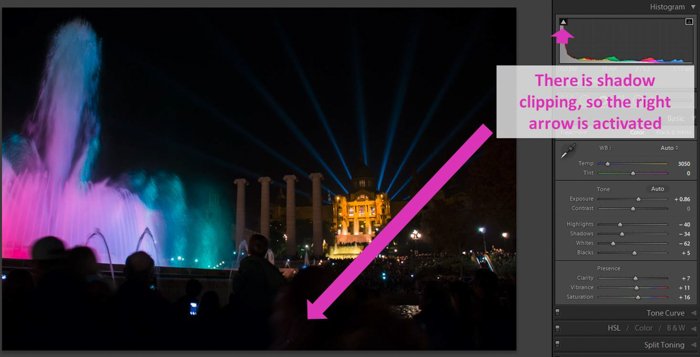
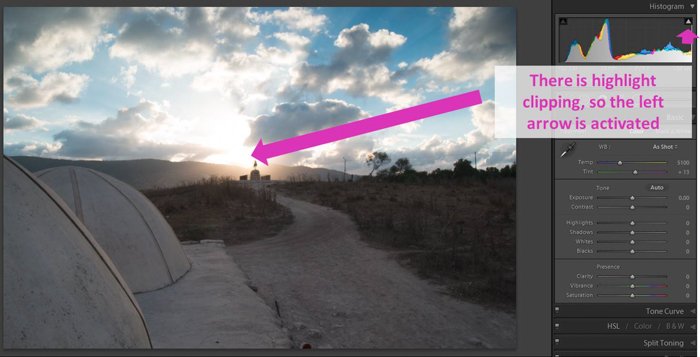
Lightroom offers you a bit of help in recognising clipped areas. A quick way is to take a look at the little arrows at the top corners of the histogram.
The one to the right corresponds with the highlights. The one to the left corresponds with the shadows.
If the arrows are deactivated, this means that you have no clipped areas in your image.
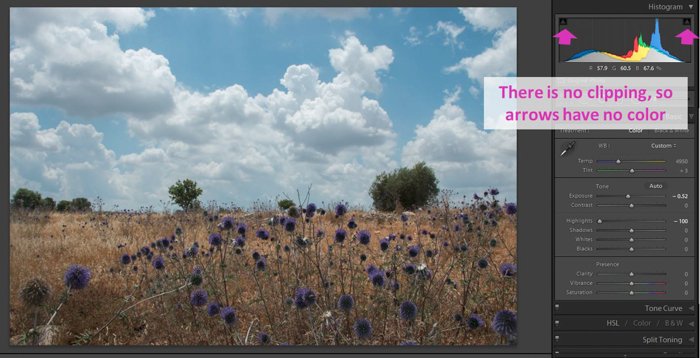
If they are activated, it indicates that there is some level of clipping.
This is a quick way to check. It is not the most informative as it doesn’t say where or how many pixels are clipped.
Use the Lightroom Warning Colors to Detect Clipped Areas
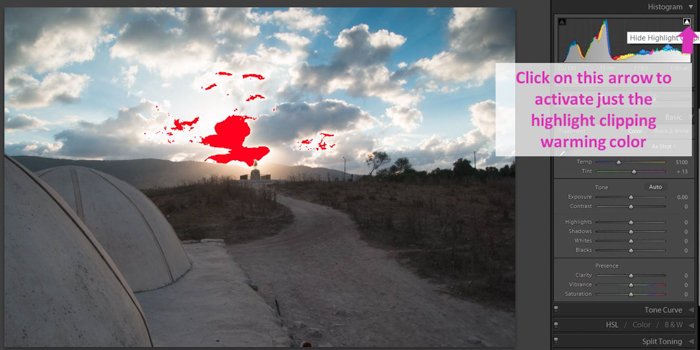
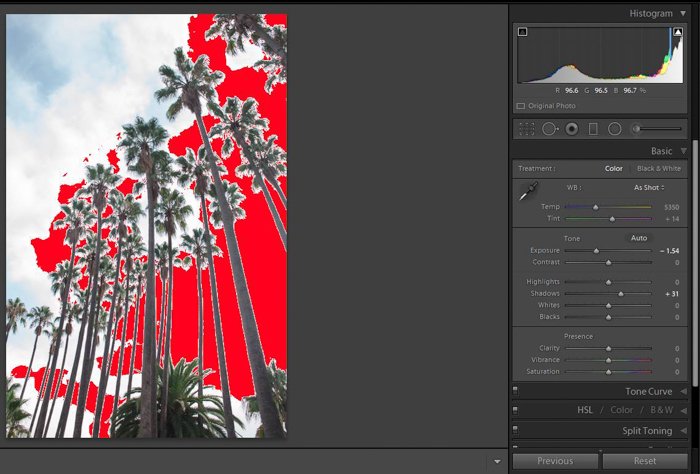
A more accurate way to check clipping is by activating the clipping warning colors. You can do it using the shortcut J.
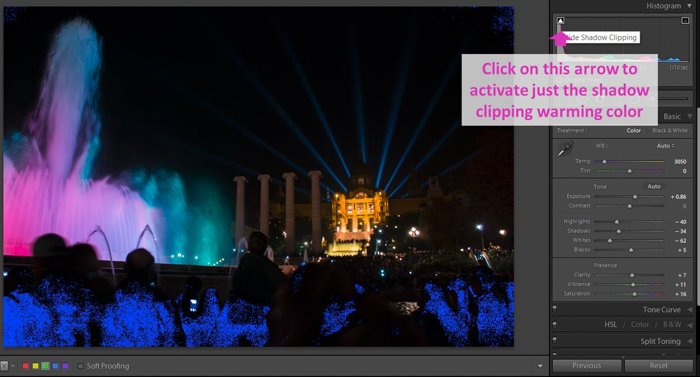
Lightroom will mark the clipped shadows in your image with blue. The clipped highlights will appear in red. You can deactivate it by clicking on J again.
If you want to activate only one of the warning colors, click on one of the little arrows at the top of the histogram. If you want to mark the shadows, click on the left arrow. If you want to mark the highlights, click on the right one.
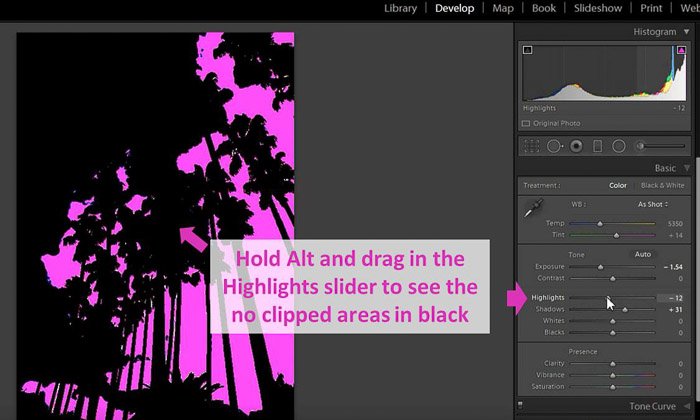
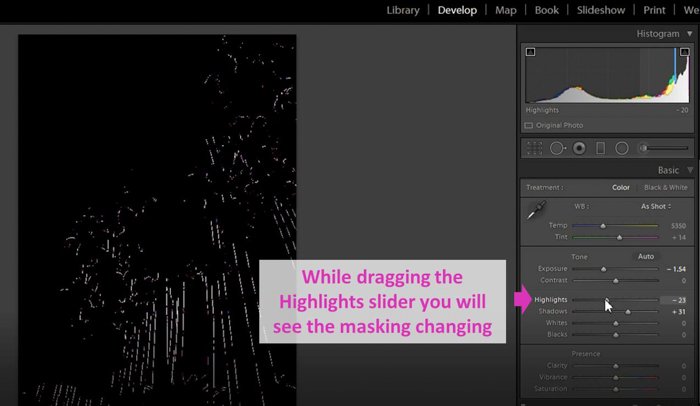
Another way to check the clipping is holding Alt (Option) and dragging any of the sliders of the Basic panel (except for the contrast slider).
Lightroom masks the areas that are not clipped. While moving the slider, it will show you the ones that are clipped in different colors. This is because of the adjustments you are making.
Fix Clipped Areas Using the Basic Sliders
Lightroom allows you to fix clipped areas. First of all, activate the clipping warnings to see what areas in your photo have problems. Then, move the sliders of the basic panel until you decrease the clipping to an acceptable level.
Two sliders are especially useful: Highlights and the Shadows. By moving the Highlight slider to the left you will decrease the Highlights. By moving the shadows slider to the right you will recover detail from the shadows.
How to Fix Shadow Clipping in Underexposed Images
You might have underexposed images with clipped shadows. I would start by increasing exposure. Then move the shadow slider to the right to recover details from these areas.
I will also play a bit with the black slider. While making these changes, you might lose a bit of contrast, so I usually increase it with its slider.
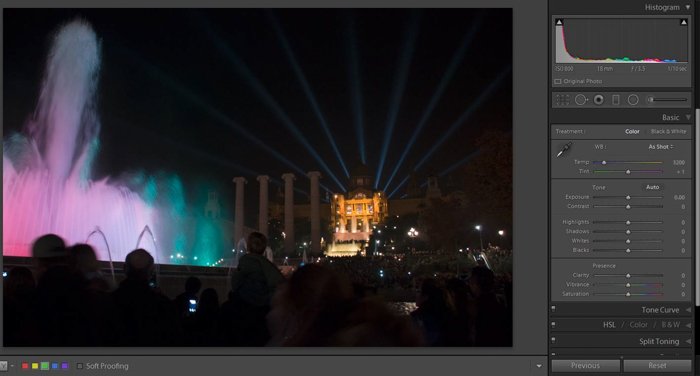
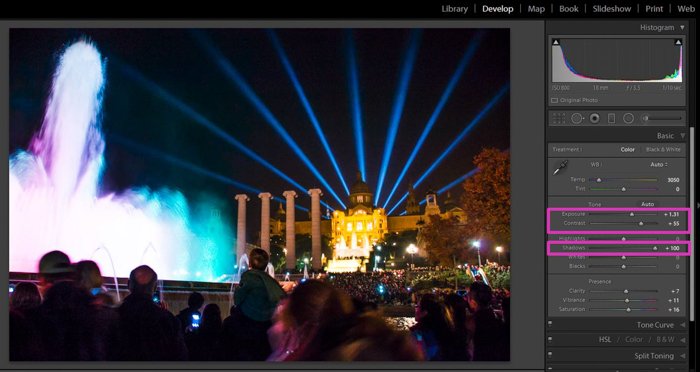
When fixing the clipped shadows you might clip the highlights. Notice that in the example, I lost detail in the water fountain.
To make sure, I checked it with the clipping warning colors.
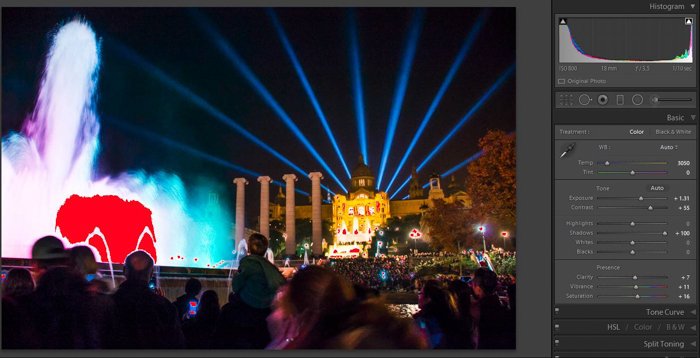
It is easy to fix. You need to readjust the highlights.
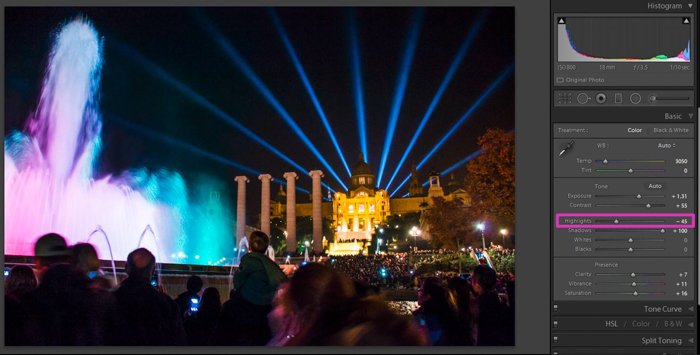
How to Fix Highlight Clipping in Overexposed Images
You might have an overexposed image with clipped highlights. In this case, I always move the highlights slider to the left and I decrease the exposure.
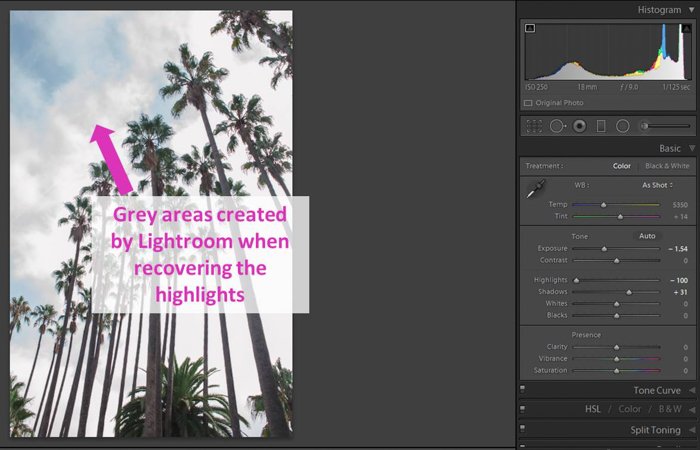
You might have areas that are burnt in the original photo. You’ll need to know something that Lightroom does. When trying to recover them, it adds grey to pixels that originally are blown out.
In some cases, this effect might work well. But if you have a big area to recover, you might not like the result.
Use the Lightroom Histogram to Overcome Display Issues
This is one of the great advantages of working with the histogram. It displays the tonal and color attributes of the image regardless of the screen quality and settings.
Using the histogram, you can check the accuracy of your display. If the image appears relatively bright but the histogram is located to the left, this tell us two things. One, that the image is underexposed. And two, that the brightness settings of the screen are too high.
This is important if you plan to have the image displayed on other screens. And it’s even more important if you intend to print it.
Conclusion
The Lightroom histogram can be a very powerful tool if you take the time to understand it. It shows you how to make more relevant corrections to your image. And it helps you see problems in your photos such as over or underexposed areas.
You can use it to check and follow the changes you make to the photo. You can even use it to make adjustments instead of using the slider bars.
Why not check out our posts on cloning in Lightroom or the common Lightroom mistakes you’re probably making next!
